My minimal install of Ubuntu with all installed Virtual Machines
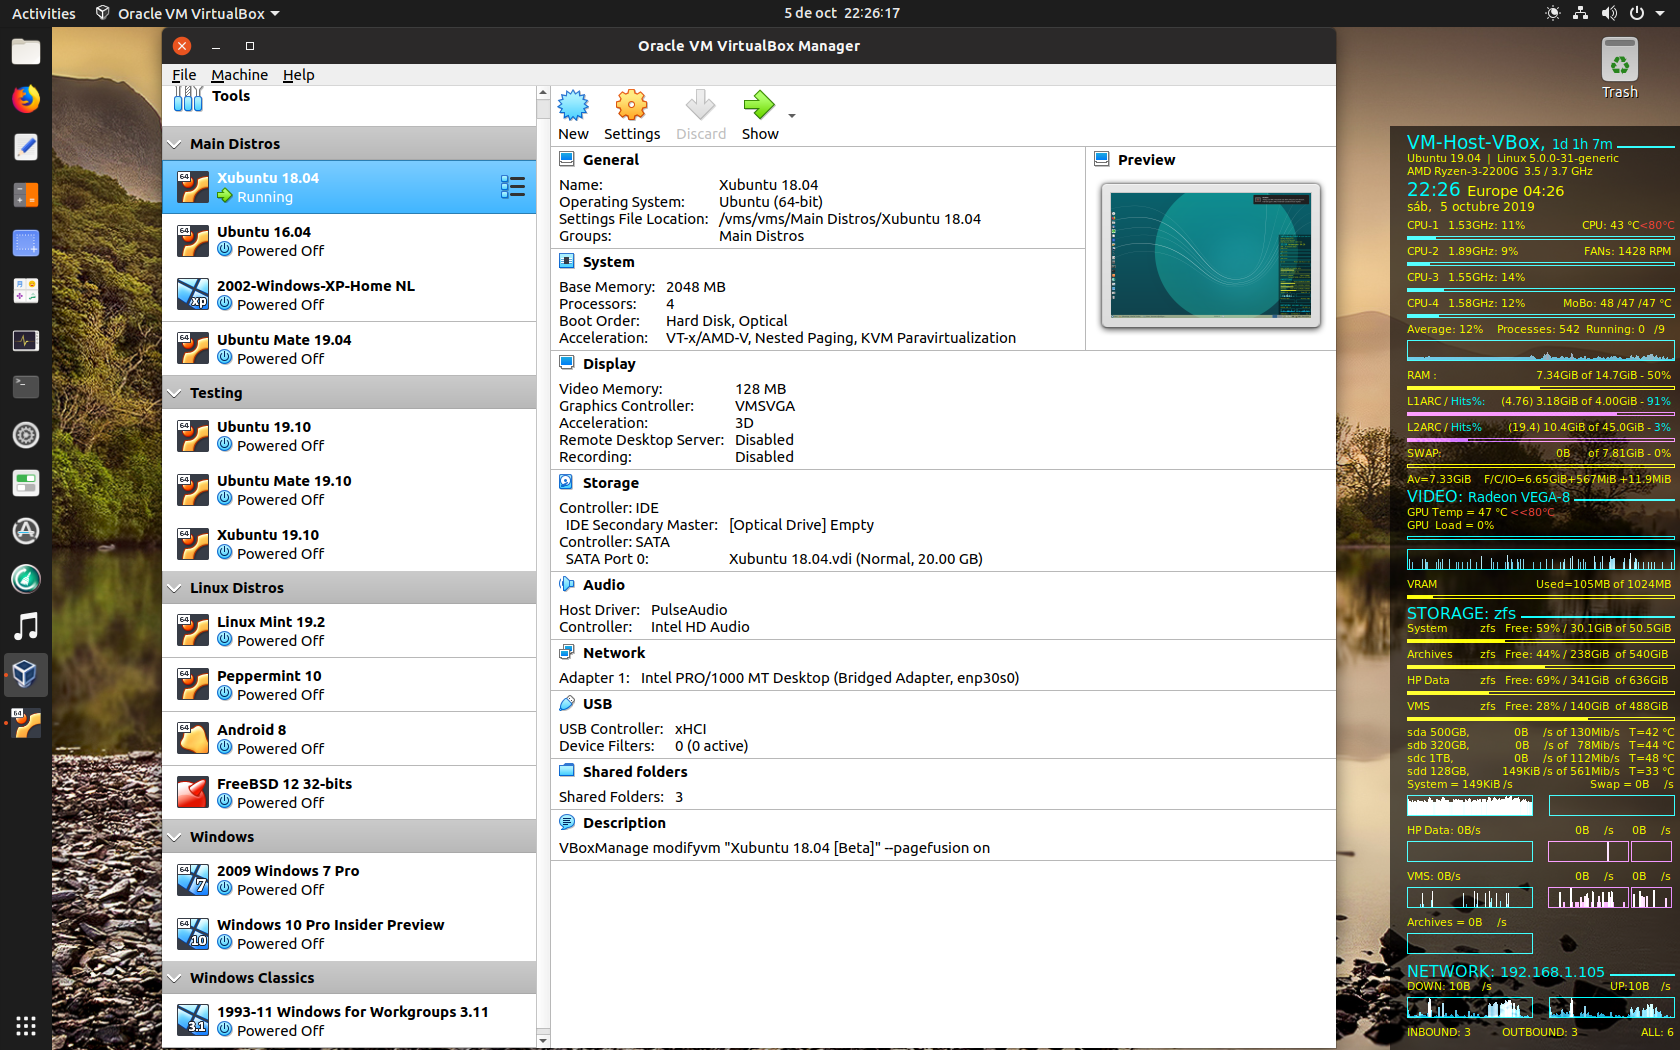
Conky:
Yellow bars are size related (space)
Cyan bars and graphs are load related (time)
Pink are ZFS related (cache):
- The memory cache (L1ARC) and SSD cache (L2ARC) sizes: (uncompresed) compressed and the hit rates
- The disk throughput is given as : Cyan, sum of 3 striped HDDs; Pink, SSD Read Cache + SSD Write Log