At work when I am asked for this type of information, it’s usually across many, many servers. I usually use Ansible to pull the info with various parameters, depending what I am looking for.
My GOTO is inxi or neofetch as well. I like that inxi is easy to filter results with a single flag, no grepping required.
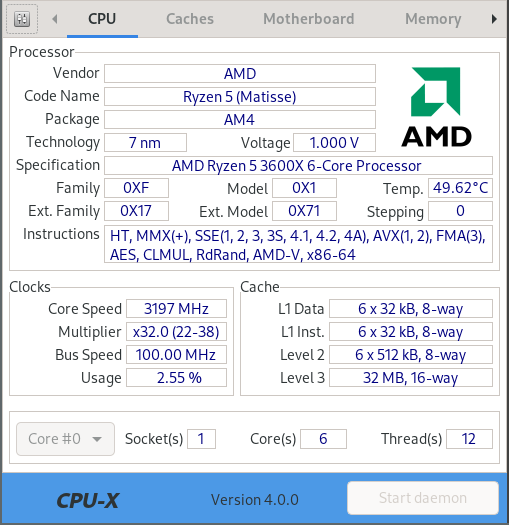
I always thought it would be amazing if Linux had a cpu-z equivalent but literally never searched for such a thing lol, good to know it’s there.
I use ifconfig a lot, although it’s deprecated now. The newer ip command is good too and has some nice ARP features I would usually have to install another package for.
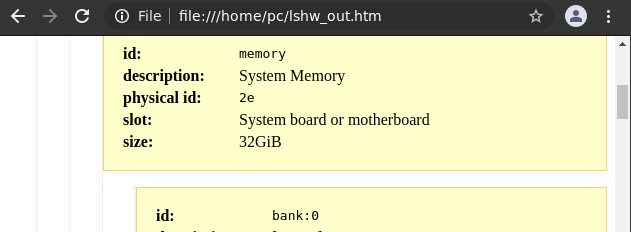
I’ve used inxi, lshw, and of course neofetch (and screenfetch)…but never heard of cpu-x until today. TIL! I think i prefer cpu-x for interactive getting of the info, but inxi and lshw for outputting the info to a text file…regardless, all of these tools are so great!
This is a good refreshment on these tools. You get so used to using the same one all of the time that you forget that you had forgotten about the others.
Hardware for Linux offers something called a Probe. It snapshots your computer’s hardware state and uploads it to their public database with a unique identifier allowing you to share it with a link and contribute to helping FOSS creators spots trends among many other things like the HDD/SSD Desktop-Class Reliability Test study.
Probes are available in AppImage/Docker/Snap/Flatpak format - how to guide.
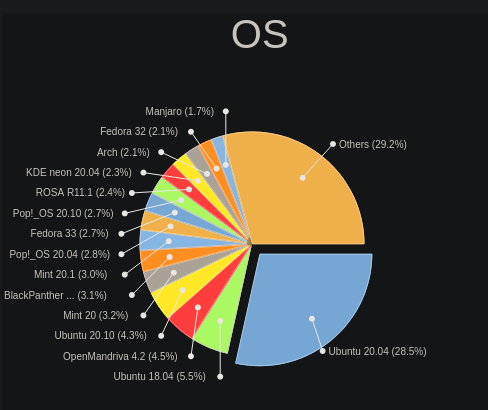
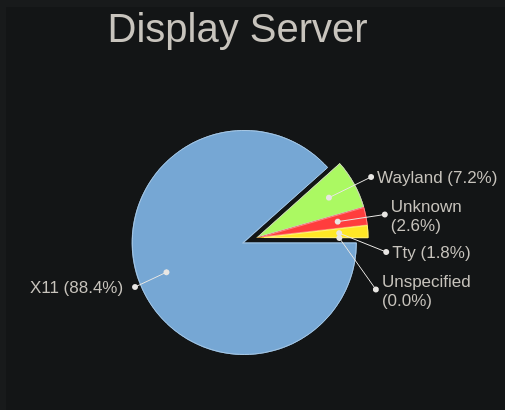
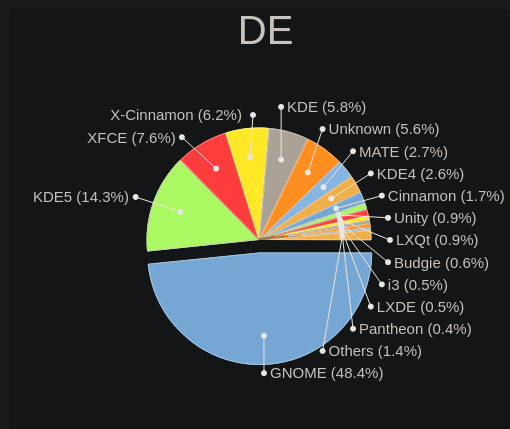
They also use the database to create cool charts like these!
A few example screenshots:
Step aside distrowatch! Here’s the market share among probes last year…
(20.10/20.04/18.04 Ubuntu combines to 38.31%)
Display server market share among probes last year…
Ok, I might be at risk of revealing my age by saying this, but here goes…Back in the day, I used to work for a small company that supported small to medium sized business’s. I was a Novell Field Engineer and I often used a tool named ConfigReader to pull the config of a Netware server for each of my clients. It detailed some of the same information being listed here.
For me the newcool thing for me is eBPF. In short this is a facility now built into recent kernels. To install this toolset just install
bpfcc-tools
This will bring in example programs and documentation about how they were written. Useful commands are
biotop-bpfcc a kernel level I/O top
21:52:54 loadavg: 1.82 1.68 1.55 1/2941 370980

PID    COMM             D MAJ MIN DISK       I/O  Kbytes  AVGms
0                       R 259 0   nvme0n1      5     0.0   0.60
466    dmcrypt_write/2  W 259 0   nvme0n1     33     0.0   0.30
biolatency-bpfcc Summarize block device I/O latency as a histogram every second:
Tracing connect ... Hit Ctrl-C to end
PID    COMM         IP SADDR            DADDR            DPORT
3547   iwatch       4  127.0.0.1        127.0.0.1        25
and gethostlatency-bpfcc Show latency for getaddrinfo/gethostbyname. useful for trying to figure out why your webpages are lloading slowly when your network speed seems fine.
“inxi strives to support the widest range of operating systems and hardware, from the most simple consumer desktops, to the most advanced professional hardware and servers.”