Ubuntu 21.04 and Bleeding Edge OpenZFS 2.0

UNDER CONSTRUCTION

I boot and run Ubuntu 21.04 Beta from OpenZFS 2.0.2 and I like to share the marvelous performance of my cached good old HDDs.

I think boot times give a first idea of the performance during normal operation for home usage. I measured the following boot times for a virtual nachine:
Ubuntu 21.04: Boot times nvme-SSD vs RAM + SSD cached HDDs = 13.8 vs 15.5 → 12% differences of performance.

Those HDDs are my 500 GB Seagate Barracuda (7.8 power on years;135MB/s; 15.3 msecs average seek time) and my 1 TB WD Black (8.5 power-on years; 106MB/s; 10.3 msec average seek time). Both drives will switch off, if not used during 5 minutes and both drives are used for less than 10% of the time. Almost all my IO is done by my 512GB nvme-SSD (Silicon Power; 3400/2300MB/s).

My main hobby is collecting Virtual Machines (VMs) and as such I have for example all Windows versions from the last 35 years, starting with Windows 1.04 to Windows 10 and all Ubuntu LTS releases from 4.10 to 20.04 LTS and 21.04 Beta.

Both HDDs have a striped 420GB partition, the 500GB HDD has some additional small partitions for recovery like an ext4 based Ubuntu 20.04 LTS installation.
I have added a sata-SSD for caching (Silicon Power 128GB; CDM: 500/450MB/s). For the two striped partitions I have added a 90GB sata-SSD cache (L2ARC) and for the remaining partition of 580GB of the 1 TB WD Black, I have added a 30GB L2ARC. The 8 GB remainder of the SSD is used for synchronous write cache.

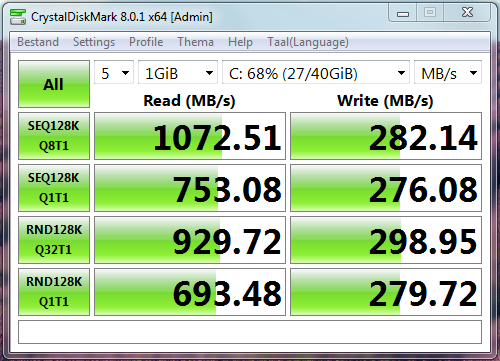
The performance of those ancient HDDs is amazing, see the screenshot:

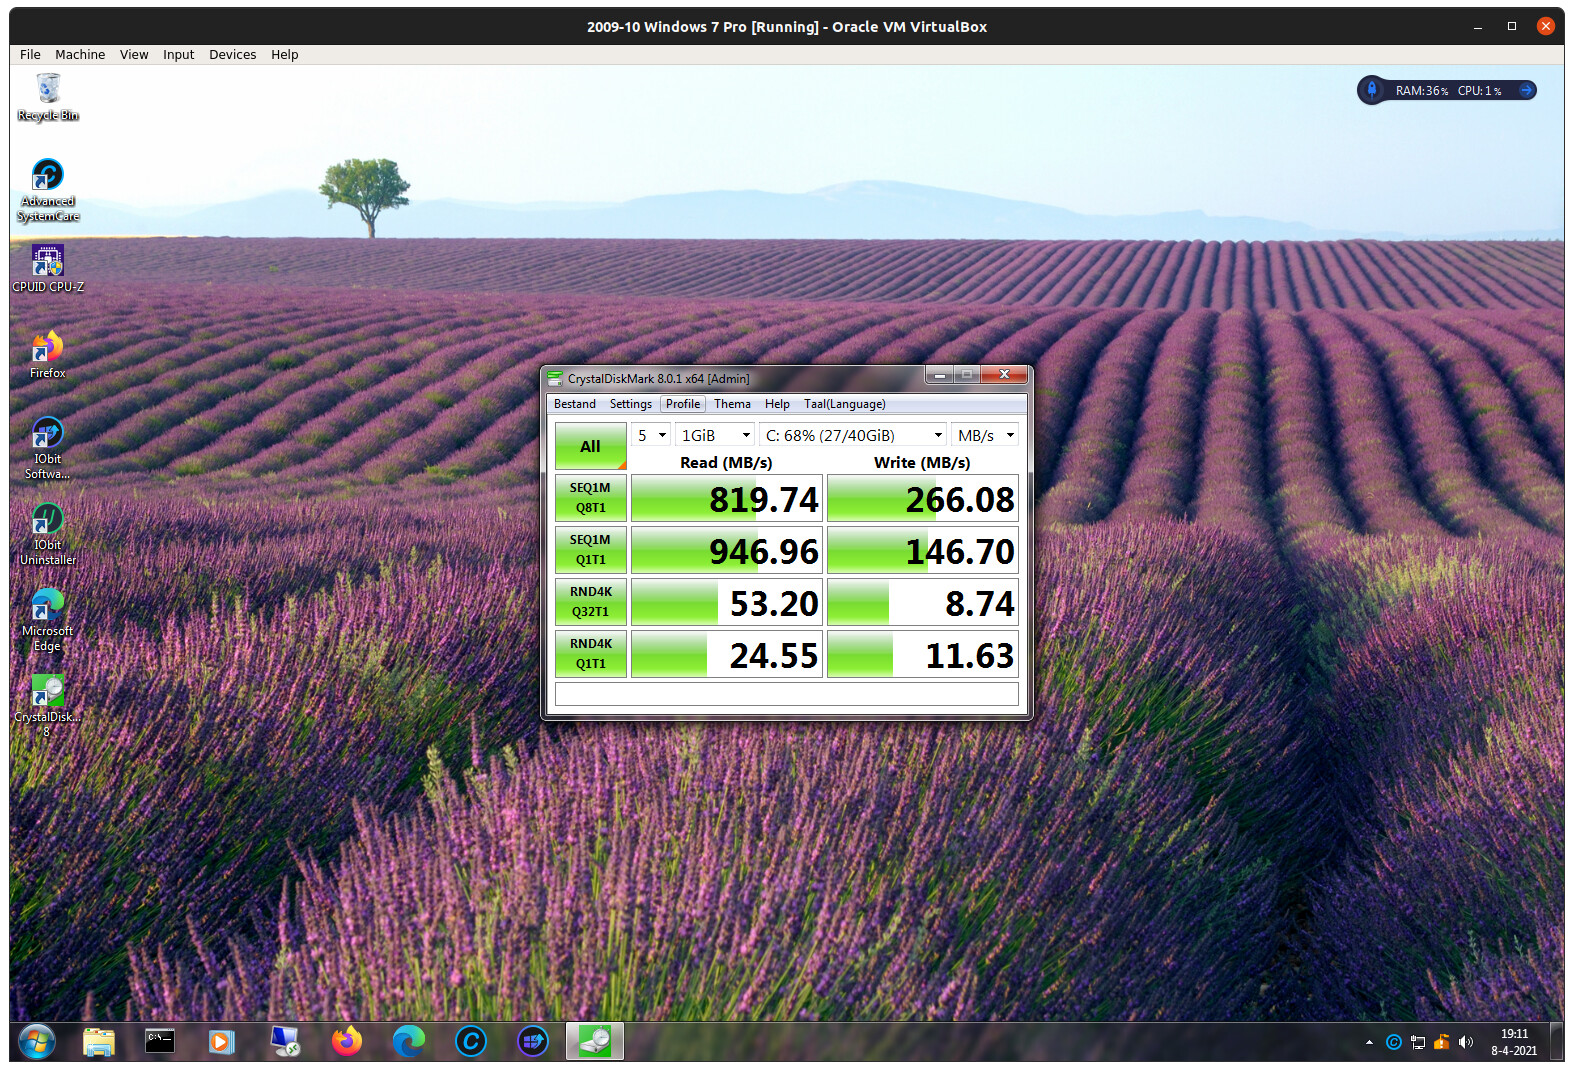
In the middle we can see ChrystalDiskMark running on a Windows 7 Virtual Machine with the values achieved by those old HDDs assisted by the 2 caches. The sequence is
Virtual Disk (.vdi) —> L1ARC (memory 4GB) —> L2ARC (SSD 90GB) —> striped HDDs (840 GB).
For all read operations it has the advantages of:

  • both caches L1ARC (Hit Rate >97%) and L2ARC (Hit Rates from 2% up to 50%) and
  • all data is lz4 compressed with a typical compression ratio of ~1.8.

For the sequential reads it achieves a performance close to some of the cheaper nvme-SSDs! After the second run say 98% of the data is read from the L1ARC, thus from memory. The Host ZFS system has to find the compressed data in the cache, decompress it and transfer it to the CDM program in Windows 7, there is no physical IO involved. I see the same effect starting e.g Firefox in a VM, the first time it must be read from L2ARC (SSD cache) or from the striped HDDs, so you notice it. Afterwards reloading Firefox is instantaneous. The 15% difference between Q1T1 at 947 MB/s and Q8T1 at 820 MB/s is difficult to explain. I expect, it has to do with peak CPU loads, when firing 8 IO operations at once, instead of one at a time.

For the random read operations the throughput looks worse, but to give CDM one uncompressed 4K record, ZFS has to read a compressed 128k record from one of the 2 caches or from the striped HDDs. When correcting for the record size the Host OS deals internally for Q32T1 with 128/4 x 53 MB/s is ~1702 MB/s, but in the Host those records are compressed so we are dealing with 1702/1.8 is ~946 MB/s, which is again very close to the values for sequential IO. Since no physical IO is involved, we are only dealing with reading data from the memory cache and those basic values should be more or less the same for all types of operations, the only difference is the OS & ZFS overhead involved for the different record sizes and queue depths.
For RND4k Q1T1 the values are 128/4 x 24.55 / 1.8 is ~436 MB/s, which is approx half of all other values. We have to realize that the before mentioned overhead is maximal, if you want to read 1 GB of 4k records one at a time.

For the write operation it has no advantage from the L2ARC and it uses the following hardware:
Virtual Disk (.vdi) —> L1ARC (memory 4GB) —> striped HDDs (840 GB).

ZFS for its write cache (LOG/ZIL) only supports synchronous writes and none of the writes used by CDM are synchronous writes. For write-operations the L1ARC collects for 5 seconds all writes, compresses them; sorts them based on the location on the platters and then writes them out in one sequence of IO operations directly to the striped HDDs. For the 2 HDDs the theoretical read throughput is 240MB/s, let’s assume the theoretical write throughput is 75% of the read throughput so 180MB/s.

Sequential Write Q8T1 (Eight write operation of 1 MB are Queued using 1 Thread) seems to run at 266 MB/s. The Host is compressing each record and writes the compressed records to disk, so it runs at 266 / 1.8 = 148 MB/s
Sequential Write Q1T1 (One write operation of 1 MB is Queued using 1 Thread) runs at 147 MB/s, taking compression into account it runs at 147 / 1.8 = 82 MB/s. The values seem correct, since I have seen this type of throughput also during normal operation. If I compare it with the theoretical write speeds, they seem realistic too. However I can’t explain the difference, since normally for single HDDs those two values are almost equal. Maybe the difference can be explained by:

  • The HDDs are striped, so a seek operation on one disk can be done in parallel with read operations on the other. That parallelism would probably be more effective with Q8 than with Q1.
  • The OS/ZFS overhead for dealing with 8 sequential operations at once or 1 operation per time.
  • The number of HDD seek operations needed might be different based on the queue depth.

For the random write operation the throughput is a factor 10 better than for a normal single HDD with CDM. The write operation must be done to different location on both striped disks.
So we have to take into account the times for:

  • the OS/ZFS latency for the write operation
  • The seek/access time to the different locations on the disk on average for my 2 disks ~12msec
  • On average half the revolution time of the 7200rpm HDD for the actual write, on average ~4.5msec

We are dealing with striped HDDs and the write operation is reported complete to Windows/CDM as soon as write operation has been queued in the L1ARC for the disk. Also all these random asynchronous write operation are collected for 5 seconds, sorted based on the location on the platter and written to the disk in one sequence of operations. Another complicating factor is that those 4K CDM records are compressed by ZFS. It has become to complex to reason about it, you only can measure the end result.

Besides real world performance differs dependent on the content of the caches at each moment in time. E.g boot times between the nvme-SSD and the frequently used, striped and cached HDDs can be as close as 13.8 vs 15.5 secs or it can be 50 secs for Windows 8.1 only booted once many days ago.

Some experimentation with record sizes in host and VM might help with the understanding.

1 Like

Using the same Chrystal Disk Mark block sizes than ZFS is using, both 128k

More fun, if I set the block size of CDM to 128K equal to the recordsize of ZFS, the results are much better and really interesting :slight_smile:

Screenshot from 2021-04-09 00-38-11

I noted that in the Host the number of MB/s is half (~140MB/s). CDM will see ~280MB/s, because all those records are compressed by the Host, so ZFS only writes ~140MB/sec of compressed data to the HDDs. My normal lz4 compression ratio is indeed close to 2. Note that these random writes of CDM are NOT synchronous writes, because the LOG (Synchronous Write Cache) has not been used. The used hardware for the write is:
Virtual Disk (.vdi) —> striped HDDs (840 GB).

So basically we see the write performance of the striped disk as experienced by CDM/Windows 7. It is 2 times as high than the physical throughput, because of the compression by ZFS.

Note that the random write behavior is completely predictable, if CDM uses 128k records, the throughput is completely dependent on the HDD performance. The "strange: results of the previous test should be completely explainable through the difference in record sizes

In the read tests there is almost no disk activity not on the HDDs nor on the SSD (<3% from the totals in CDM), so the whole read operation is served from the L1ARC. The sequence of the IO operations is thus:
Virtual Disk (.vdi) <— L1ARC (memory 4GB).

I think this part of the test is realistic, because always during normal operation I see L1ARC cache hit rates of 97%, so the miss rates are equal to the 3% I noticed during this test :slight_smile:

Boot Time Remark ext4/ntfs:
Ext4 also has the concept of a kind of super-block consisting a variable number of blocks, that are used to store larger records completely consecutive with a super-block admin in the first block. That might explain the 2 to 4 times better boot times of the Linux VMs compared to the Windows VMs.
It is not that the Linux developers are 2 to 4 times smarter than the Microsoft developers.

The remaining questions are:

  • What happens, if we vary the recordsize of ZFS?
  • What happens, if we install Windows and e.g Ubuntu using the optional 64k cluster/block sizes?
1 Like

A distraction c.q. side kick about compression.

I live in interesting times after I moved the Windows 7 VM to a ZFS dataset that was NOT compressed, see the astonishing results:

Screenshot from 2021-04-09 16-52-46

The reported performance dropped by a factor 40 to 90, crazy so what happened?
The first thing I noticed, the L1ARC did not change during all those tests with an uncompressed VM, the size of the L1ARC only flipped between 3.13 and 3.23. It left almost 1 GB of cache space unused, while the memory had also ~4GB free. What did I learn?

I assume that uncompressed VMs are not cached not in L1ARC and thus not in L2ARC. Maybe they only go to the small mini cache that is used for uncompressed records. That would explain the small variations in the L1ARC size during the test :slight_smile: The resulting sequence is:
Virtual Disk (.vdi) —> striped HDDs (840 GB).
So this measurement represents the “raw” performance of Virtualbox for disk IO. Not good, that is probably, why QEMU/KVM is considered faster than Virtualbox.

First kill all uncompressed datasets! My action will be to destroy the two uncompressed datasets of ZFS after moving the VMs stored there to a lz4 compressed dataset. I already had the impression, that their boot times were relatively slow.

Secondly look at the performance of the VMs at ZFS record sizes of 4K; 32K; 256k and 1M :slight_smile: I also have to consider a little bit the backup transfer times to my backup server.

1 Like

Record Size and Performance

Two graphs given a calculated average for the measured throughput for each ZFS record-size. The calculation is based on the expected system behavior with respect to:

  • percentage of reads vs writes
  • percentage of sequential IO (1 MB) vs random IO (4K)

20210331_mbs

in another use-case the results might look slightly different:

2021033_mbs

The end result shows that the default record-size of 128k seems to be a good choice and you should avoid the lower record-sizes.

From the previous stuff it is clear that the best results are achieved by running CDM with the ZFS 128k record size. We have proven now, that changing the ZFS record size to match the ntfs/ext4 cluster sizes (4k) is very contra productive!
However both the ntfs and ext4 file systems allow also 64k cluster sizes. However to test it, we first have to detect how to install Windows and e.g. Ubuntu on partitions with those cluster sizes. There seem to be issues, when installing systems on that cluster size.
An easy way to bypass that issue is to install the Ubuntu VM on ZFS. It results in 2x compression, but on detecting non compressible data, ZFS abandons the compression activity.

We have detected two issues:

  • Don’t mix compressed datasets and uncompressed datasets, it ruins all your caching. Maybe it is a bug, but currently it is a bad idea and I have destroyed those datasets.
  • The default 128k record-size and probably the two next values 64k and 256k seem the optimal choice.

A record-size of 1m also seems probably OK for my use-case and it is considerably faster moving e.g complete VMs from one location to another. I will have a look, whether it also improves the ~1 hour incremental backup time over my 1 Gbps network.

Added Results:

  • The incremental backup happens at the same speed for 128k and 1m record sizes in my system! The back up is from 2019 Ryzen 3 to a 2003 Pentium 4. (Remember the CPU Passmark ratings are: Pentium 4 HT 3.0GHz = 310 and Ryzen 3 2200G = 6759, a factor 20). The limiting factor in both cases is the CPU load of the Pentium. The transfer speed ~200Mbps and Pentium CPU load ~95% are the same for both ZFS record sizes. Probably the CPU load is determined more by the handling of the 1518 bytes frames (MTU) coming of the Ethernet.
  • Average VM boot times are almost the same for 128k and 1m record sizes, which confirms the result of the 2 graphs, especially the last one:
    Windows 7: Boot times 128k vs 1m = 26.25 vs 27.5 ---------> 5%
    Ubuntu 18.04 LTS: Boot times 128k vs 1m = 10.6 vs 11.2 ----> 6%

For my home usage I will stick to the default ZFS record size of 128K. Remains the question about the ntfs/ext4 cluster/block sizes of 4k vs 64k

Ubuntu with zfs-128k and ext4-4k block sizes

The average boot times I measure for Ubuntu 21.04, were:

  • 15.50 seconds for zfs with the default 128k record size.
  • 12.48 seconds for ext4 with its default 4k block size.

Both systems boot completely from the L1ARC cache. I would explain the difference as follows; the zfs system has to handle the L1ARC including its decompression twice and my CPU is relatively slow for a modern CPU, say a factor 2.5 slower than e.g a modest Ryzen 5 3600. Two other interesting numbers are:

  • The first time I booted the VM from the cached and striped HDDs, the time was 56.5 seconds. That time has been completely determined by both striped HDDs.
  • The average boot times from the nvme-SSD was 12.65 seconds. Basically equal to the ext4 boot time of the cached and striped HDDs. Another proof beside the 98% hit rate, that the VMs boot completely from the L1ARC cache after the first time.

Adapted measurements with 40GB virtual disk and 1MB records.
ZFS
While ext4 is 24% faster than zfs during booting, the picture is confirmed more or less using the Gnome Disk Utility. For ZFS I did two runs the first one with both L1ARC caches active and the second with only the Host cache active.

  1. The average read throughput of zfs with both caches was 1.5 GB/s, the write throughput 967MB/s and the access time was 8.0 milliseconds (seek time of the striped disks).
  2. The average read throughput of zfs with only the Host cache was 1.5 GB/s, the write throughput 958MB/s and the access time was 7.8 milliseconds.

There was no significant difference between both measurement, 2 x caching or 1 x caching did give the same result. The following picture shows the first try and its environment.

Note that in the peaks we read at the speed of PCIe 4.0 nvme-SSDs, thanks to the L1ARC, but in the lows we read at the speed of the striped HDDs :slight_smile:

Notice the L1ARC size of the Host OS in the pink color at the extreme right, the Host OS L1ARC has 1.69GB and uncompressed it is seems to be 0.54GB. Strange, I can’t yet explain the behavior of the Host L1ARC, while running the Gnome Disk Utility.

  • The L1ARC has become much smaller from 4GB to 1.69GB.
  • The uncompressed size is considerably smaller that the compressed size, very very strange!
  • The values for the Guest OS L1ARC size was 5.8 MB, see below in the arcstats.

EXT4
The average read throughput of ext4 with the 1MB record size seem to be 2.2GB/sec, the write throughput 1.0 GB/s and the access time was 0.11 msecs. See the graph below.
But more interesting is the pattern in the graphs.

That boundary in the behavior is exactly at 21.3GB, the location, where we go from occupied to free space. Note that these virtual disk files are new, so physically at 55% of the 40 GB size. In contradiction those Windows 7 vdi files are years old and full of data and old discarded data and are consequently at full size.

  • That free space does not exits in the real world :slight_smile: Those records read in the last 45% of the disk will be physically very close together in the compressed vdi file in the host.
  • Note that the write speed of the second part of the test is worse, because here the Host has to allocate additional space for the test record in the Host ZFS file system. The Host vdi file has to be extended with many times 4k, before the 1MB test record can be written.
  • Looking at the begin of the graphs the read speed is probably closer to 1.6 GB/s and the write speed 1.4 GB/s. Read speeds of ext4 and zfs are almost the same, the write speed of ext4 seems considerably better than zfs. The write speed is better, because ext4 will overwrite the records, while ZFS uses always Copy On Write, so a new record needs to be allocated in the free space. That means the host has to allocate additional space to the vdi file all the time.
  • The very low average access/seek times 0.11 msecs are probably also caused by the L1ARC, since 97% of the records are in the Host L1ARC.

For a more accurate measurement we will have to fill the last 45% of the virtual disk. A fixed size virtual disk should also help, because the free space on the physical disk will be full of old discarded content after 8 power-on years. Even ZFS can’t compress that old stuff very effectively.

I also have to take care that a test takes considerably more than 5 seconds, because e.g ZFS collect the writes during 5 seconds in the L1ARC and then writes them all out sorted on position to disk, I think ext4 has a comparable mechanism. We have to run the test at least for a couple of minutes, otherwise we only measure the interaction with the L1ARC in the Host and writing to disk is done largely or completely after the test has been completed.

The test with ext 64k cluster size in ext4 is for another day.

I finished the last section with:

  • For a more accurate measurement we will have to fill the last 45% of the virtual disk.
  • I also have to takes care that a test takes considerably more than 5 seconds, because e.g ZFS collect the writes during 5 seconds in the L1ARC and then writes them all out sorted on position to disk. We have to run the test at least for a couple of minutes, otherwise we only measure the interaction with the L1ARC in the Host and writing to disk is done largely or completely after the test has been completed.

So we filled the virtual disks till 95%. Unfortunately I can’t run those test with the Gnome Disk Utility for a couple of minutes, because for some reason they limit the number of IO operations to 1000. The total time the test runs is 12 to 15 seconds.

If you look at the graph at 85% say 850 reads/writes, the read throughput collapses. That point has been reached exactly after 5 seconds :slight_smile: The remaining 15% of the test takes the other 8 to 10 seconds. During this time the system is writing out all 850 records stored in the L1ARC in the first 5 seconds. Those write operations seem to significantly reduce the number of the read operations in the last 15% of the graph.

In the last 5% you still see the effect of a vdi disk, that is 95% full. During those last 5% the host has again to allocate additional space for the last 5% of records that still has to be written to the last not existing 5% of the virtual disk.

In the case of ZFS you have to demount the datapool and in the case of ext4 you can run the benchmark mounted or demounted. That is the reason, I assume that the GDU is using low level IO operation, independent from the file system used in the partition. Besides GDU does not support ZFS, it can’t format nor mount drives/partitions using ZFS like it does for ext4.

To support that assumption compare both graphs, the first one with the ext4 formatted file system (sdb) in the VM and the next one with the zfs file system in the VM (sdc).

In the first 5 seconds/85% of the test NO physical IO operations are done, all IO operations are served by the L1ARC. Those max throughput values (for 1 MB records and 50% division between read and write operations) are for the 2200G: ~1.5 GB/s for the read and 1.3 GB/s for the write operations.

As a consequence:

  1. With GDU you mainly measure the performance of the Host OS file system and it is independent from the file system used in the VM. The results and behavior are thus the same as shown in the two graphs.
  2. The performance measurements with GDU are too short (1000 IO operations) and the measured values are unrealistic and thus irrelevant.
  3. With my system (Ryzen 3 2200G) the L1ARC and thus the CPU determines the maximal read and write throughput the VMs can achieve (1.5/1.3 GB/s), my nvme-SSD (3.4/2.3 GB/s) will be severely limited by the 2200G when using ZFS (and EXT4?) :frowning:

That is supported by the boot times I noticed for VMs. After e.g a power failure the Linux VMs would boot from nvme-SSD in say ~10 seconds and a reboot largely from L1ARC would take ~8.5 seconds. So I already knew booting from memory was not much faster than booting from nvme-SSD, so the CPU introduced latency did largely determine my boot times.

So I need a faster CPU to improve boot times, unfortunately 4000G and 5000G APUs are for the OEM only and not for the DIY peasants.

Probably I will skip the test with 64k cluster/block sizes for ext4, because I’m severely limited anyhow by the Host ZFS and the 2200G as proven by the GDU with its low level IO operations. Looking at boot time comparisons, Linux Distros are more performant than Windows and thus ext4 seems to be more performant than ntfs, probably that ext4 super-block support compensates for the ancient default 4k block sizes.